Lei Hou♠, Juanzi Li♠
Abstract
Large language models (LLMs) have recently demonstrated strong capabilities as autonomous agents, showing promise in reasoning, tool use, and sequential decision-making. While prior benchmarks have evaluated LLM agents in domains such as software engineering and scientific discovery, the finance domain remains underexplored, despite its direct relevance to economic value and high-stakes decision-making. Existing financial benchmarks primarily test static knowledge through question answering, but they fall short of capturing the dynamic and iterative nature of trading. To address this gap, we introduce StockBench, a contamination-free benchmark designed to evaluate LLM agents in realistic, multi-month stock trading environments. Agents receive daily market signals---including prices, fundamentals, and news---and must make sequential buy, sell, or hold decisions. Performance is assessed using financial metrics such as cumulative return, maximum drawdown, and the Sortino ratio. Our evaluation of state-of-the-art proprietary (e.g., GPT-5, Claude-4) and open-weight (e.g., Qwen3, Kimi-K2, GLM-4.5) models shows that while most LLM agents struggle to outperform the simple buy-and-hold baseline, several models demonstrate the potential to deliver higher returns and manage risk more effectively. These findings highlight both the challenges and opportunities in developing LLM-powered financial agents, showing that excelling at static financial knowledge tasks does not necessarily translate into successful trading strategies. We release StockBench as an open-source resource to support reproducibility and advance future research in this domain.
System Overview
Comprehensive framework architecture and workflow
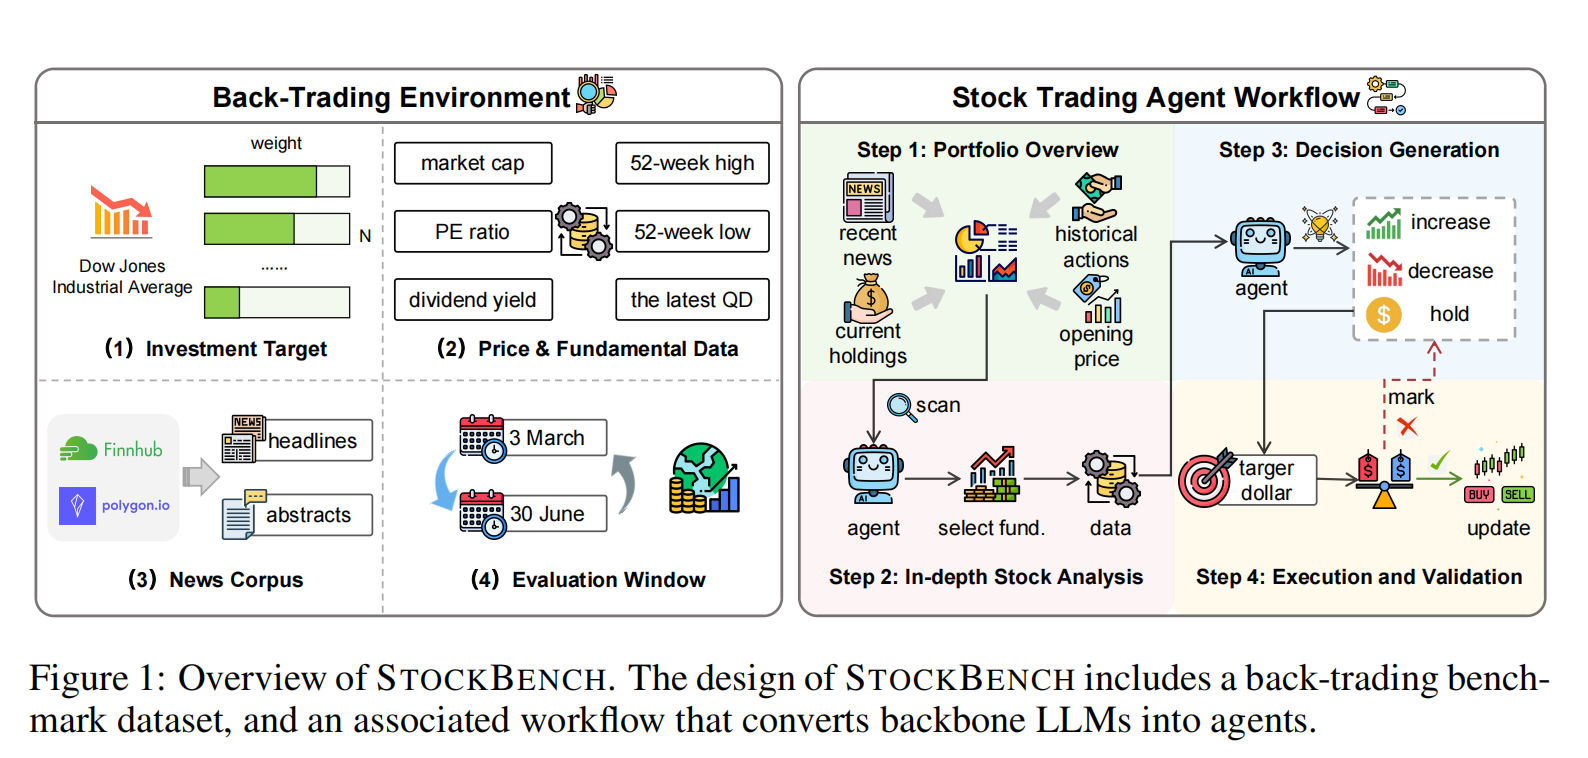
Figure 1: Overview of STOCKBENCH framework, including back-trading environment and stock trading agent workflow
Investment Targets
Diverse portfolio representing major market sectors
We select the top 20 stocks from the Dow Jones Industrial Average (DJIA) by weight as our investment targets, ensuring diverse representation across major sectors while avoiding short-term irrational market sentiment.
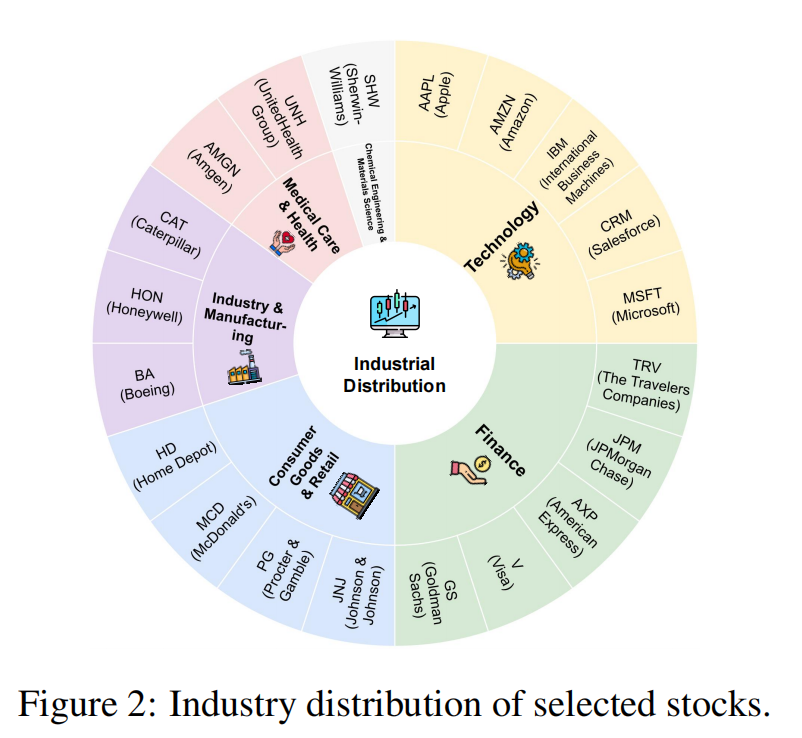
Figure 2: Industry distribution of selected investment targets
Technology
Apple (AAPL), Amazon (AMZN), IBM (IBM), Salesforce (CRM), Microsoft (MSFT)
Representing the digital economy and cloud computing
Finance
Travelers (TRV), JPMorgan Chase (JPM), American Express (AXP), Visa (V), Goldman Sachs (GS)
Capturing financial market dynamics
Consumer Goods & Retail
Johnson & Johnson (JNJ), Procter & Gamble (PG), McDonald's (MCD), Home Depot (HD)
Representing consumer demand and retail
Industry & Manufacturing
Boeing (BA), Honeywell (HON), Caterpillar (CAT)
Reflecting industrial activity and manufacturing
Medical Care & Health
Amgen (AMGN), UnitedHealth Group (UNH)
Healthcare and pharmaceutical sectors
Chemical Engineering & Materials
Sherwin-Williams (SHW)
Materials science and chemical engineering
Experiment Setup
Rigorous evaluation methodology and parameters
Evaluation Period: March 3 - June 30, 2025 (82 trading days)
Initial Capital: $100,000 cash, zero initial holdings
Leaderboard
Performance comparison of state-of-the-art models
| Rank | Model | Final Return (%) | Max Drawdown (%) | Sortino Ratio |
|---|---|---|---|---|
| 1 | Kimi-K2 | +1.9 | -11.8 | 0.0420 |
| 2 | Qwen3-235B-Ins | +2.4 | -11.2 | 0.0299 |
| 3 | GLM-4.5 | +2.3 | -13.7 | 0.0295 |
| 4 | Qwen3-235B-Think | +2.5 | -14.9 | 0.0309 |
| 5 | OpenAI-O3 | +1.9 | -13.2 | 0.0267 |
| 6 | Qwen3-30B-Think | +2.1 | -13.5 | 0.0255 |
| 7 | Claude-4-Sonnet | +2.2 | -14.2 | 0.0245 |
| 8 | DeepSeek-V3.1 | +1.1 | -14.1 | 0.0210 |
| 9 | GPT-5 | +0.3 | -13.1 | 0.0132 |
| 10 | Qwen3-Coder | +0.2 | -13.9 | 0.0137 |
| 11 | DeepSeek-V3 | +0.2 | -14.1 | 0.0144 |
| 12 | Passive Baseline | +0.4 | -15.2 | 0.0155 |
| 13 | GPT-OSS-120B | -0.9 | -14.0 | 0.0156 |
| 14 | GPT-OSS-20B | -2.8 | -14.4 | -0.0069 |